Reflecting on my first failed product
A year after launch, I'm declaring my first product a failure. Here's why it didn't work out, and what I plan to do differently next time.
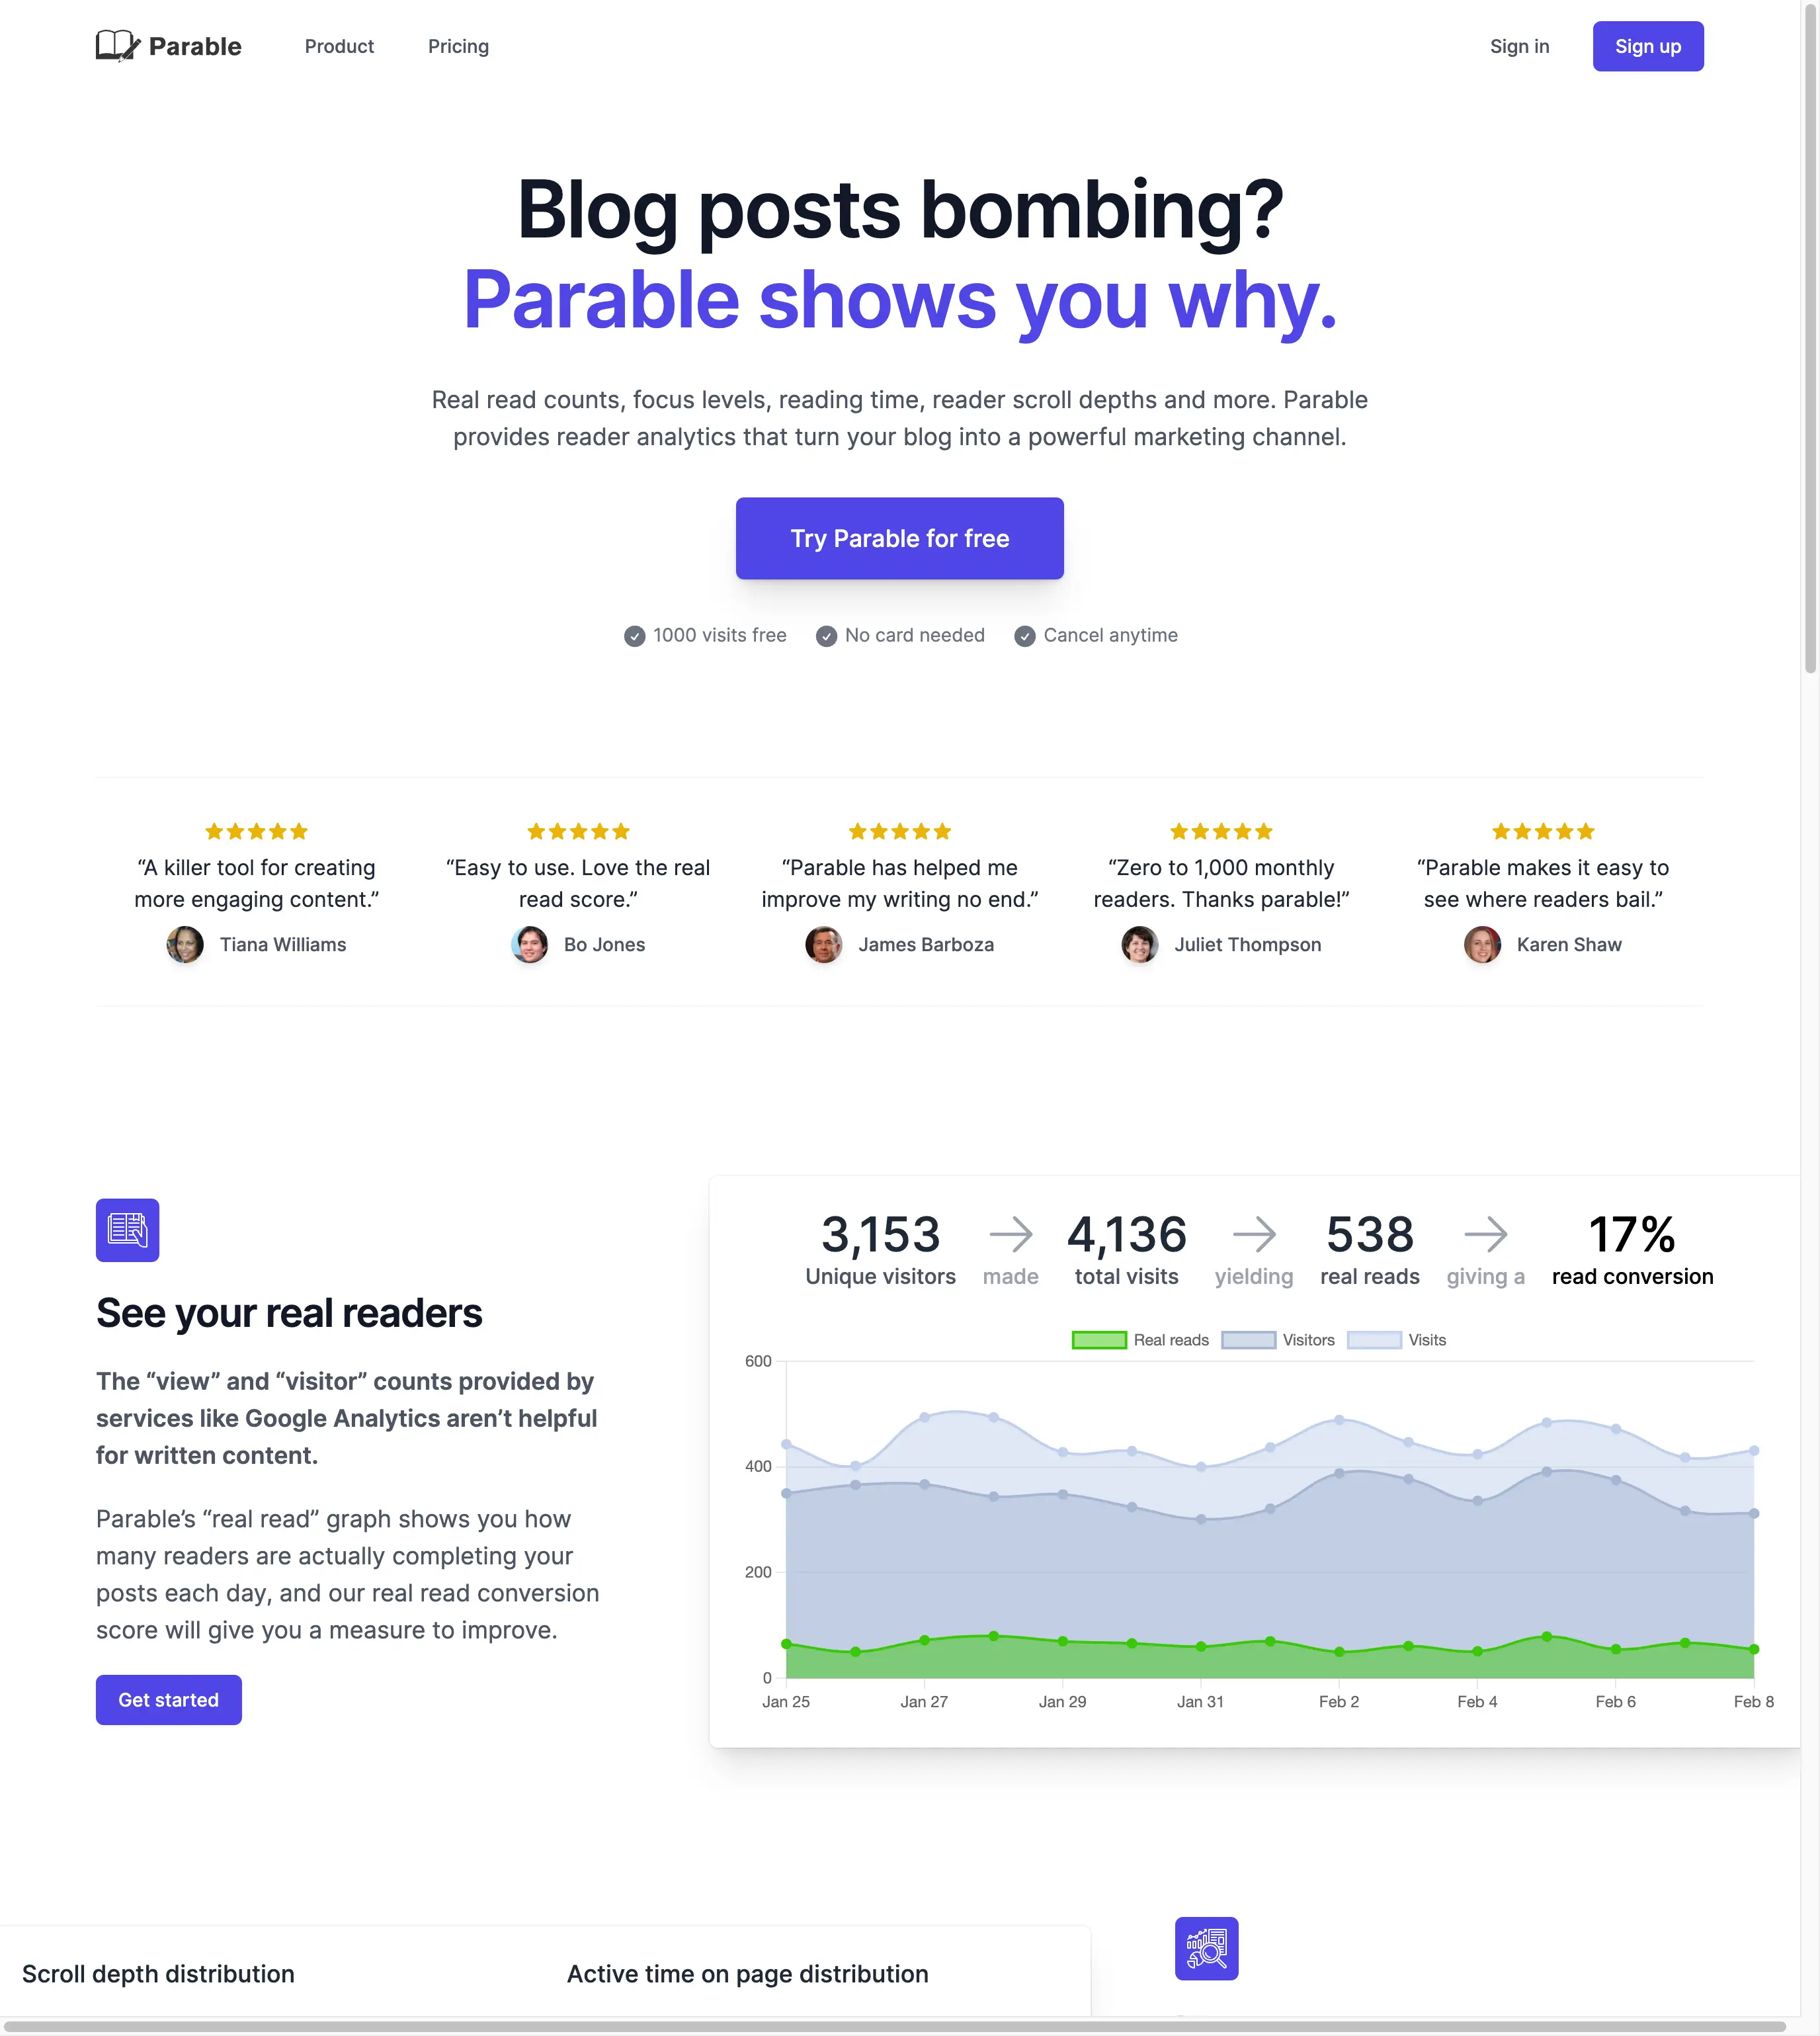
I spent my unbooked time in 2022 building Parable, an indie analytics platform for blog posts and articles. Parable intelligently tracks how many people actually read your content, and focuses on providing analytics useful to writers trying to grow an audience.
A year after launch, I’m winding down Parable to build something new. Life has taught me that repeated failure is often the price you pay for eventual success with anything, so I expected to be writing this post sooner or later. While I’ll admit it stings a bit, there were numerous reasons for me to call it quits. I’ve detailed the big 3 below.
The reasons
Real reads weren’t all that useful
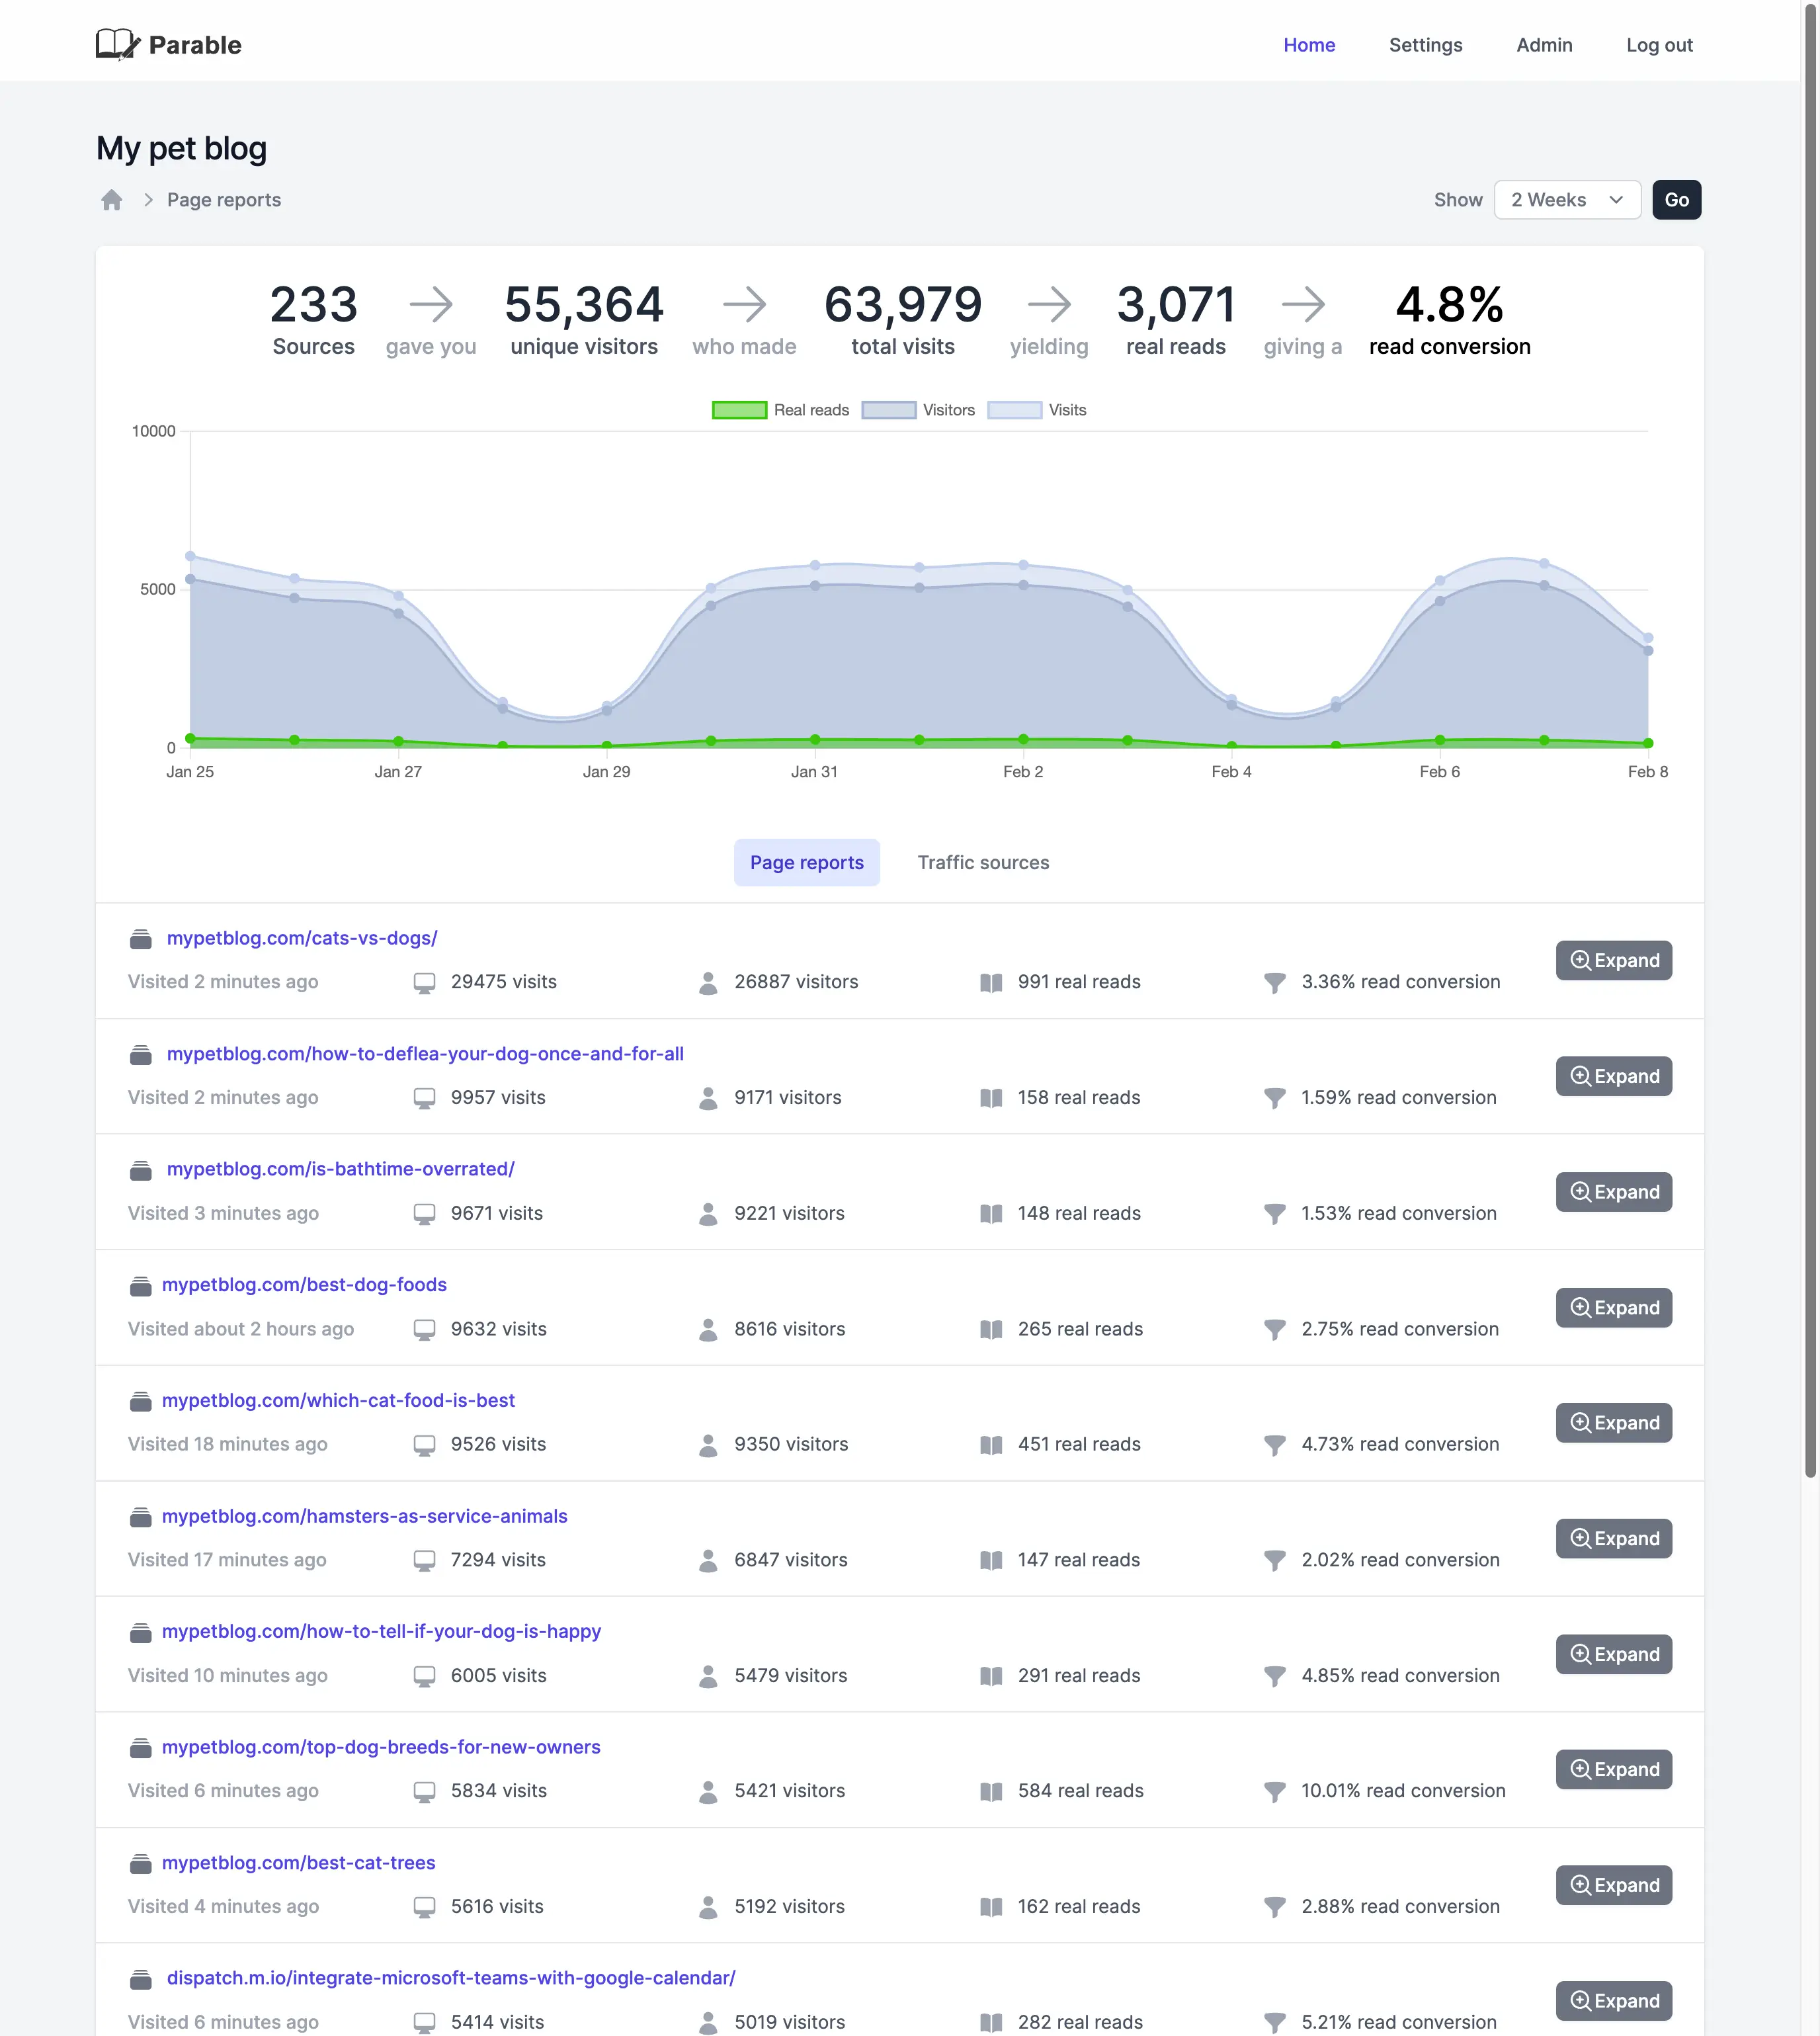
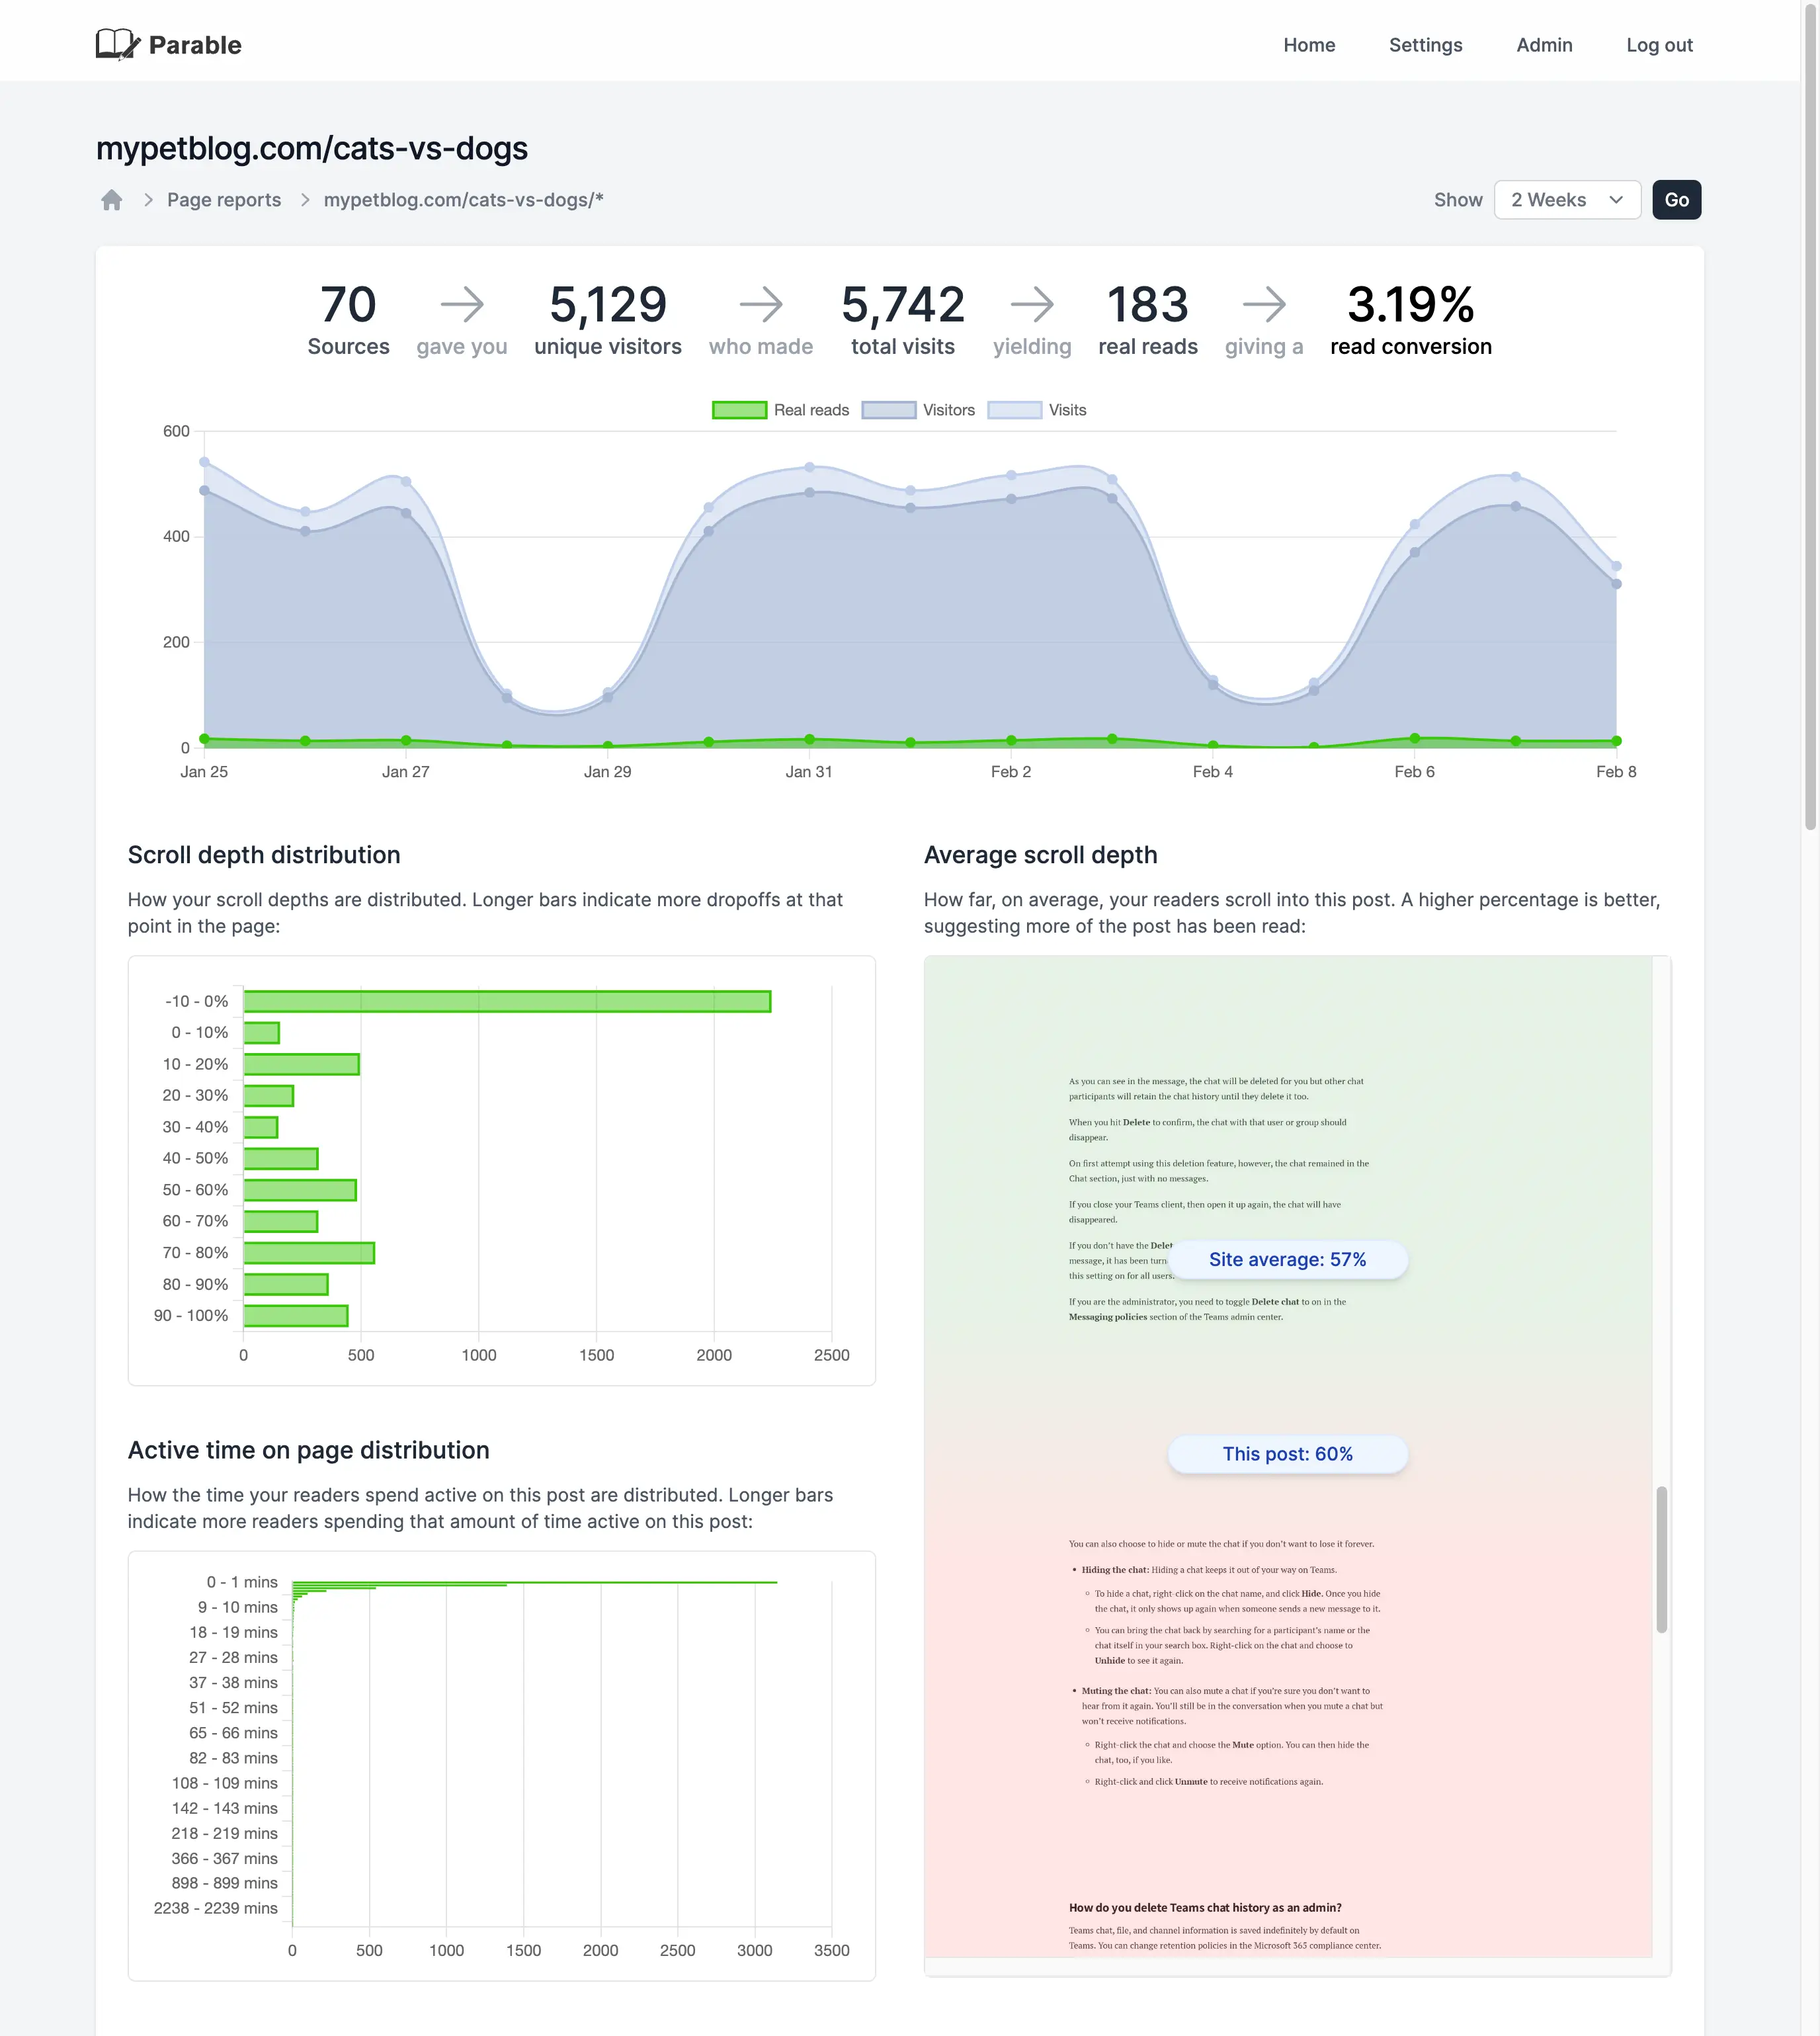
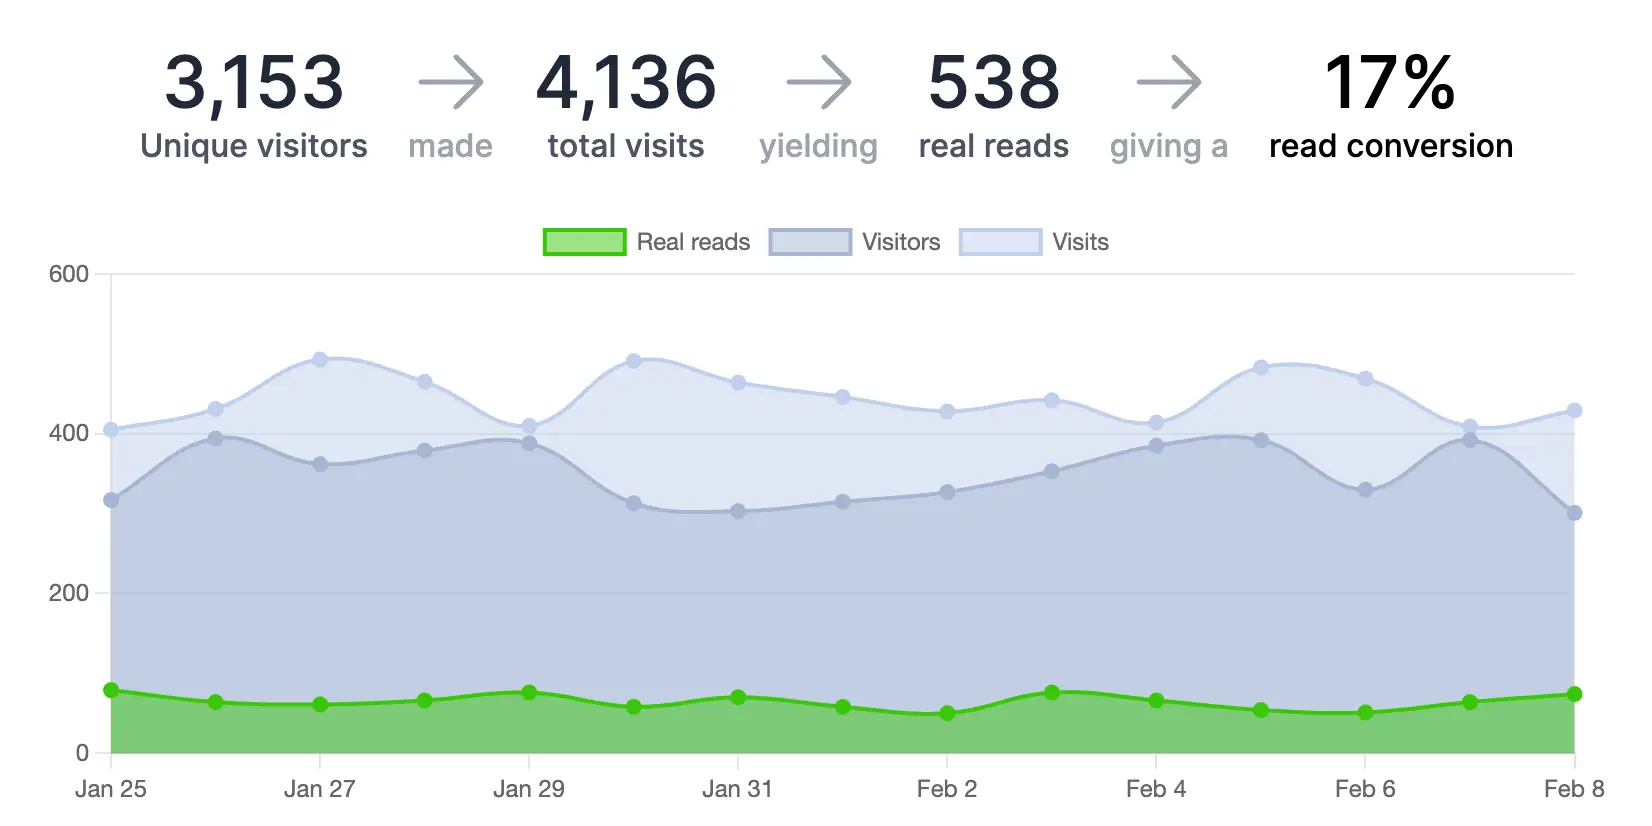
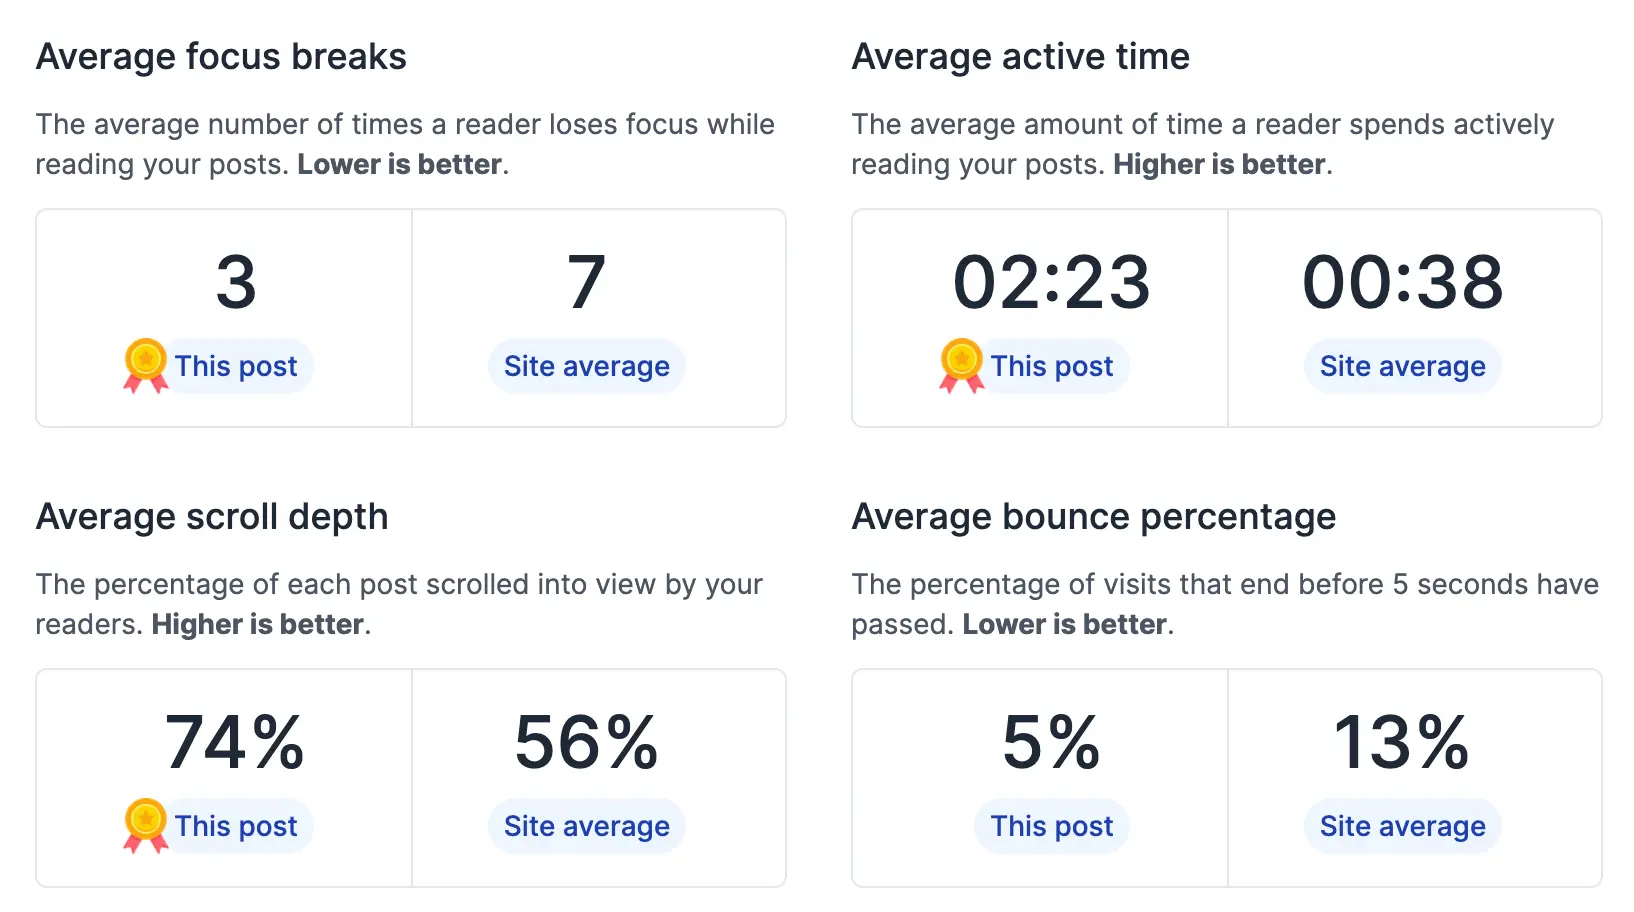
Parable’s headline feature was that it could show you how many people were reading your content, rather than just how many visits your content was receiving. It also included tools tailored for content analysis - traffic sources, scroll depths, reading times, focus break frequency, and browser stats (to name but a few!).
The information Parable surfaced was useful to have, but it was just information. Parable couldn’t automatically get you more readers, and it couldn’t even tell you how to get more readers. Its usefulness relied entirely on you finding value in the information it surfaced, and I overestimated how much that was worth to people.
As an example, knowing how many real reads your post has isn't useful in isolation. It only becomes useful when you measure its change over time to see that your continued efforts to improve your writing are resulting in more reads. However, this change can just as easily measured using a less granular metric like visits, available from any general purpose web analytics product.
Deeper insight wasn’t always necessary
I spent a few thousand pounds on various marketing exercises for Parable with little payoff, and so I decided to do what I should have done to begin with, and talk to writers about the product. Messages were mixed, but two things became clear.
The first was that new bloggers don’t look for standalone analytics products for their writing. They’ll use the built-in analytics on their blogging platform, or Google Analytics if they need something more complex. They’ll check these every once in a while as they work to get their visitor numbers up, and this will be enough for them.
The second was that professional writers were much more likely to use a range of analytics products, but they were also much more concerned with being able to sell the performance of their content. A product that tells them the 10,000 visits their post had actually only yielded 100 real reads wasn’t going to impress the people paying them, even if it represented a more honest analysis of the content.
Different needs for amateurs and professionals
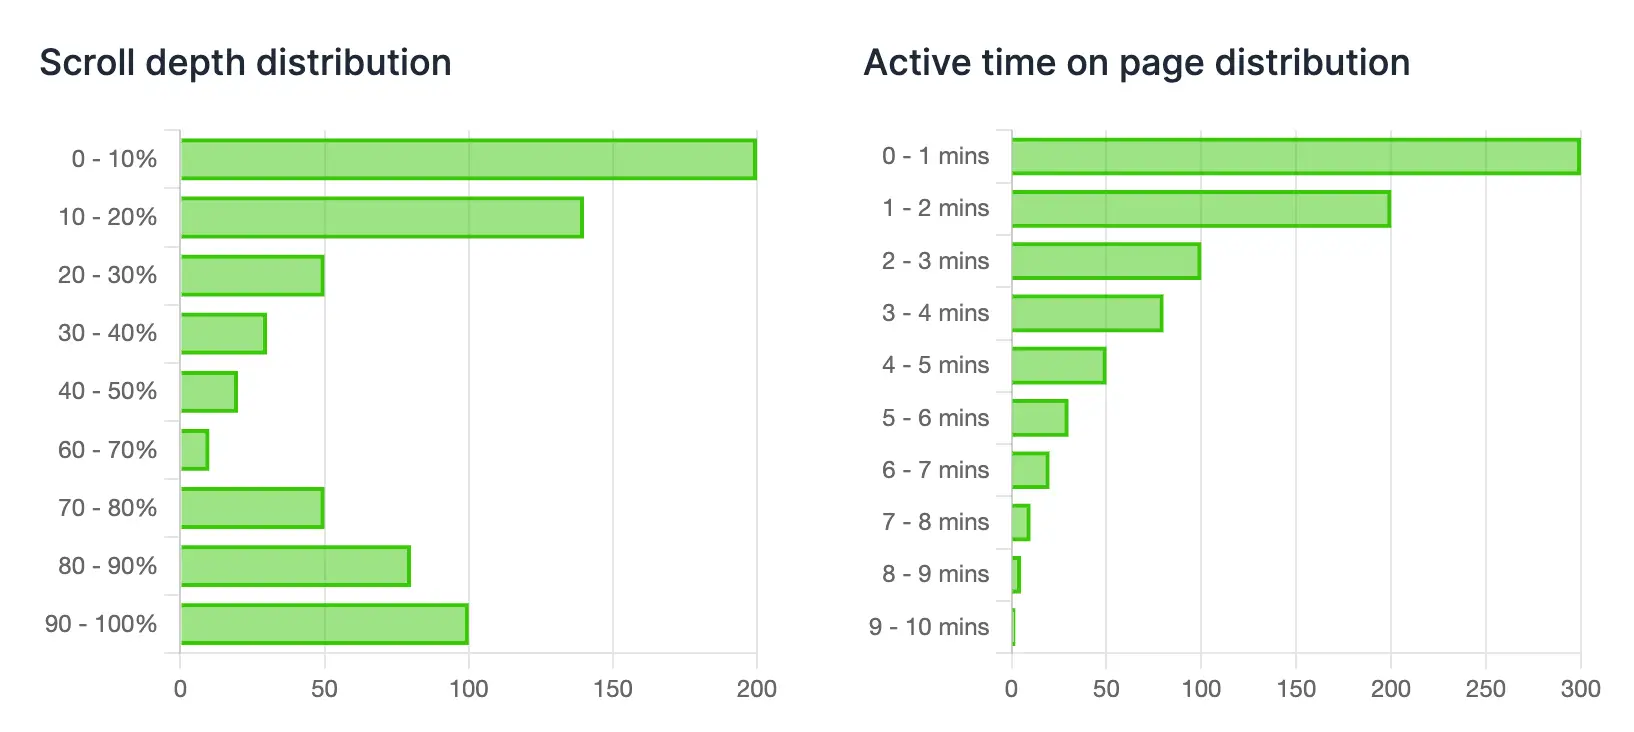
Following on from talking to writers, I talked to Parable’s users directly. In doing this, I learned amateur bloggers repeatedly failed to understand graphs, heatmaps, distributions and other reports essential to getting value from the product. The information surfaced in Parable wasn’t accessible to them, and so wasn’t actionable, and therefore wasn’t valuable.
Conversely, when I talked to professional writers using the product, they’d frequently ask if it could do more. They’d want to cross reference, break down, export data, and generally visualise things in a number of different ways that weren’t currently supported and would take a lot of rework to implement.
Parable wasn’t simple enough to be accessible to new bloggers, and wasn’t full-featured enough to provide value to professionals. I should have done more market research at the beginning, avoided wasted time, and focussed on a product for the better market (professional writers).
The lessons
While I’m disappointed to be shutting Parable down, I have no regrets about the time I spent working on it. There are plenty of common mistakes I theoretically knew to avoid around market validation, time management, and solo product development that I still managed to make while launching the product. Having experienced these first-hand though, I now feel experienced enough to spot them earlier and with more clarity next time. Here’s what I’ll do differently in future:
- Spend more time understanding problems before even thinking about technical solutions.
- Seek feedback on solutions early and continuously from potential customers.
- Sell solutions early, even if it means doing things manually to begin with.
- Establish productive marketing channels early, and nurture them continuously.
What I’m not going to do next time is worry so much about developing software. Even with an analytics product, writing Parable’s software and scaling it to handle thousands of requests per minute was by far the easiest part of the journey - sorry technical founders!
If you’re interested in reading more about Parable, I’ve left the marketing website up. I make a living by helping companies bring digital products to market with solid foundations, room to scale, and costs under control. If it sounds like I could help you, have a look over my services. If you'd like to hear more from me, you should follow me on Twitter, for more product development content in future.